
Many people's incomes have not kept pace with the rising price of items such as gasoline, bread, and vegetables, leading to much public debate. In view of the mismatch between the official inflation index and public perceptions of recent price rises, several media outlets have accused the government of massaging the figures. What is the truth of the matter? What do the price statistics issued by the Directorate-General of Budget, Accounting and Statistics (DGBAS) really say? And how should we interpret them?
On September 6 the Directorate-General of Budget, Accounting and Statistics held its regularly scheduled press conference to announce the previous month's change in the consumer price index. The conference was unusually long. Wu Chao-ming, the section chief responsible, had prepared a stack of data, and he responded to various doubts expressed about the CPI among the public and the media.

Chart II: Real wage growth in manufacturing and service sectors (1991-2006)/compiled by Andre Huang/source: Directorate-General of Budget, Accounting and Statistics
Credibility gap?
The rise in consumer prices over recent years is what precipitated this unusual scene.
Because Taiwan has limited natural resources, it relies on imports for much of its raw materials. Consequently, the price of gasoline in Taiwan has risen along with global petroleum prices. In 2002 unleaded 95-octane gasoline cost NT$20 per liter. By September of 2007 it had risen to NT$28.5, an increase of 42.5%. And the increase in the price of oil caused the price of related items, such as propane and other fuels, to rise as well. What's more, the cost of agricultural and industrial raw material imports has risen along with rising prices for them in international markets. Consequently, there have been price hikes for such essentials as sugar, flour and beverages. The rising price of these goods has had a true impact on people's lives.
Nevertheless, according to the DGBAS, from 1997 to the present the highest yearly increase in Taiwan's consumer price index was only 2% (in 2005), and from 2001 to 2003, the CPI even experienced negative growth. From these statistics it would appear that Taiwan doesn't have a problem with inflation.
What is responsible for the huge gap between the official statistics and the people's impressions?

Chart IV: Percentage breakdown of household expenditure for highest and lowest income quintiles/compiled by Andre Huang/source: Directorate-General of Budget, Accounting and Statistics
Statistics--a difficult language
The gap is partly the result of the way that the figures are interpreted.
Let's take a look at the different components of the CPI. From Chart I you can see that although the overall index has been flat or gently rising, from 2001 to 2006 the two sub-indexes of food and healthcare rose significantly, with food rising 16% from 2001 to August, 2007. For example, the price of a bowl of beef noodles rose from NT$70 to NT$80, and a fried baozi climbed from NT$8 to NT$10. At the same time, the cost of healthcare has risen 21%, which reflects higher premiums for National Health Insurance and the rising price of imported Chinese medicines. The category "miscellaneous" came in third with a rise of 11%, largely reflecting the impact of the new cigarette tax, which was imposed to promote better health. The rise in these three components of the price index has not been imaginary and has been truly felt by the public. But other components of the index have been flat or rising only slightly, so that in aggregate the CPI doesn't appear to be rising much.
When you examine food, healthcare and "miscellaneous" further, you discover that not every item in these categories experienced large rises. Although fruits, vegetables and nuts saw significant price rises, price growth for rice products was flat. Other categories that in aggregate rose little reveal, upon closer inspection, more dramatic rises and falls for individual components. For instance, in the category of transportation and communications, "communications equipment" declined by more than half since 2001, from an indexed score of 100 to 47, reflecting the dramatic fall in the cost of cell phones in recent years. At the same time, the cost of gasoline rose from 100 to 149, which reflects the sharp rise in the cost of crude oil. However, cell phones aren't an everyday purchase, so most people aren't sensitive to the price drop. But when gasoline, which people buy every few days, goes up, they have strong, frequent reminders.
What's more, the range and definition of each category can have a big impact on its index. For instance, in recent years the cost of real estate and commercial rents for stores have been inching upwards, yet the housing index has been flat since 2001 because it is confined to residential rents, building repairs, household goods, utility bills, and so forth. Among these only fuel and renovation materials have risen much. These reflect the rise in the cost of propane, as well as the cost of aluminum doors and windows and home decorating materials. The discrepancy between the flat CPI and rising real estate has left prospective buyers befuddled.
Time/Category | Food | Apparel | Housing | Transportation and communications |
Healthcare | Recreation and education |
Misc. | Overall CPI0 |
---|---|---|---|---|---|---|---|---|
2001 | 100.00 | 100.00 | 100.00 | 100.00 | 100.00 | 100.00 | 100.00 | 100.00 |
2002 | 99.80 | 100.58 | 98.88 | 97.78 | 101.29 | 100.11 | 105.09 | 99.80 |
2003 | 99.72 | 101.96 | 97.81 | 98.38 | 104.65 | 98.81 | 104.66 | 99.52 |
2004 | 104.07 | 105.15 | 97.71 | 100.43 | 106.72 | 98.91 | 105.24 | 101.13 |
2005 | 111.84 | 105.08 | 98.08 | 101.73 | 110.97 | 98.69 | 104.96 | 103.46 |
2006 | 111.09 | 102.55 | 98.91 | 103.44 | 114.63 | 98.86 | 109.14 | 104.08 |
2007/1 | 110.74 | 102.80 | 99.03 | 102.96 | 115.11 | 98.69 | 110.21 | 104.05 |
2007/2 | 108.49 | 98.75 | 101.15 | 103.69 | 115.28 | 100.71 | 111.41 | 104.45 |
2007/3 | 107.75 | 95.38 | 99.04 | 103.82 | 116.45 | 99.02 | 111.31 | 103.23 |
2007/4 | 108.70 | 111.03 | 99.05 | 104.45 | 117.89 | 99.07 | 112.22 | 104.42 |
2007/5 | 109.19 | 110.70 | 99.16 | 104.42 | 120.21 | 99.05 | 112.10 | 104.64 |
2007/6 | 110.65 | 107.71 | 100.35 | 104.77 | 120.03 | 99.38 | 111.41 | 105.27 |
2007/7 | 109.61 | 103.73 | 100.22 | 106.01 | 120.41 | 99.93 | 110.99 | 105.01 |
2007/8 | 115.79 | 100.10 | 100.29 | 105.97 | 120.69 | 99.77 | 111.21 | 106.40 |
source: DGBAS
|

The rich-poor gap
The gap between people's perceptions and the CPI also varies according to income.
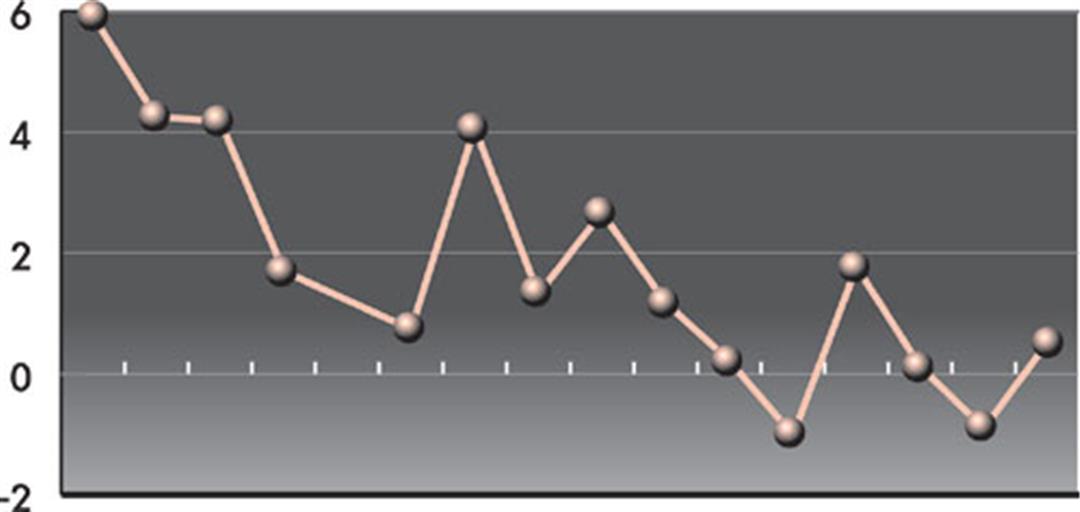
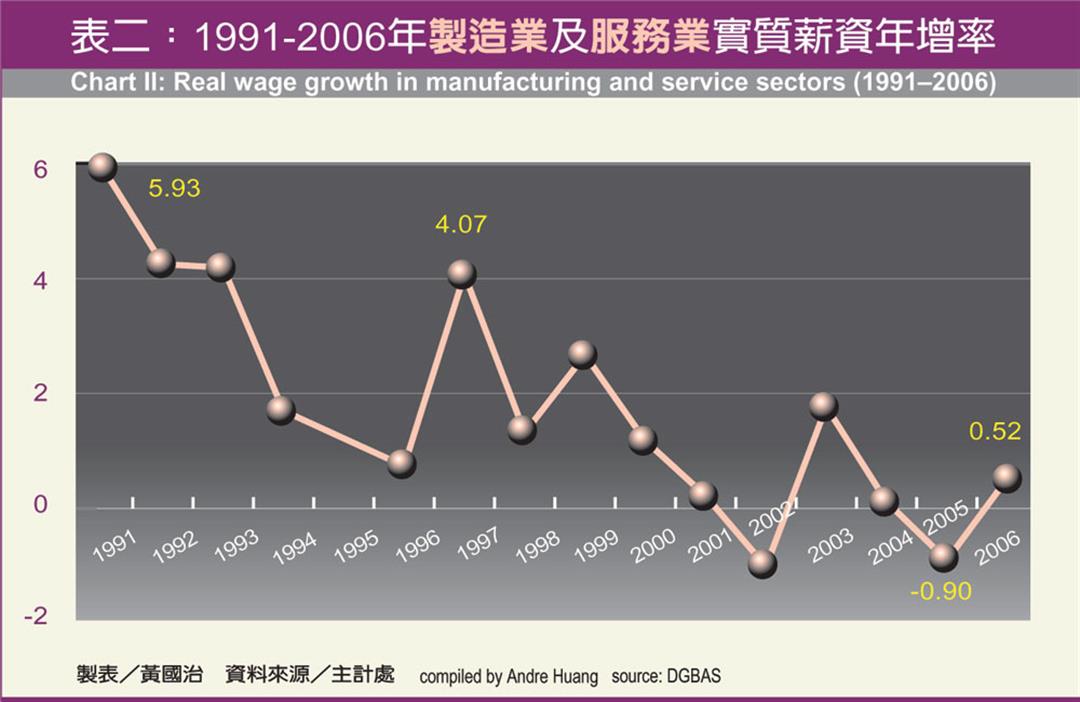
Generally speaking, if the CPI rises but incomes keep up, the public won't experience much suffering. In recent years, however, incomes have not been keeping pace with the cost of living. Chart II shows the gradual decline in real wage growth in manufacturing and services from 1991 to 2006, with some years even showing negative growth, previously a rare occurrence. With real wage growth moderating, even slight rises in the CPI can hit people's living standards.
From 1996 to 2006, average household disposable income in Taiwan increased 10.5%, but over the same period the CPI rose 8.3%. Thus the average household's income should have grown enough to cover the increase in prices.
But when you split household disposable income into five income quintiles (Chart III), you discover that the top 60% of households saw their incomes rise faster than the CPI. Moreover, the higher the income, the greater the growth. But the lowest 40% of households experienced the opposite, with the bottom income quintile seeing incomes rise less than 2% during the period. Consequently, the 8.3% rise in the CPI is an unbearable weight that has caused a drop in these families' real income. This illustrates the hit that lower-income families take when the CPI rises.
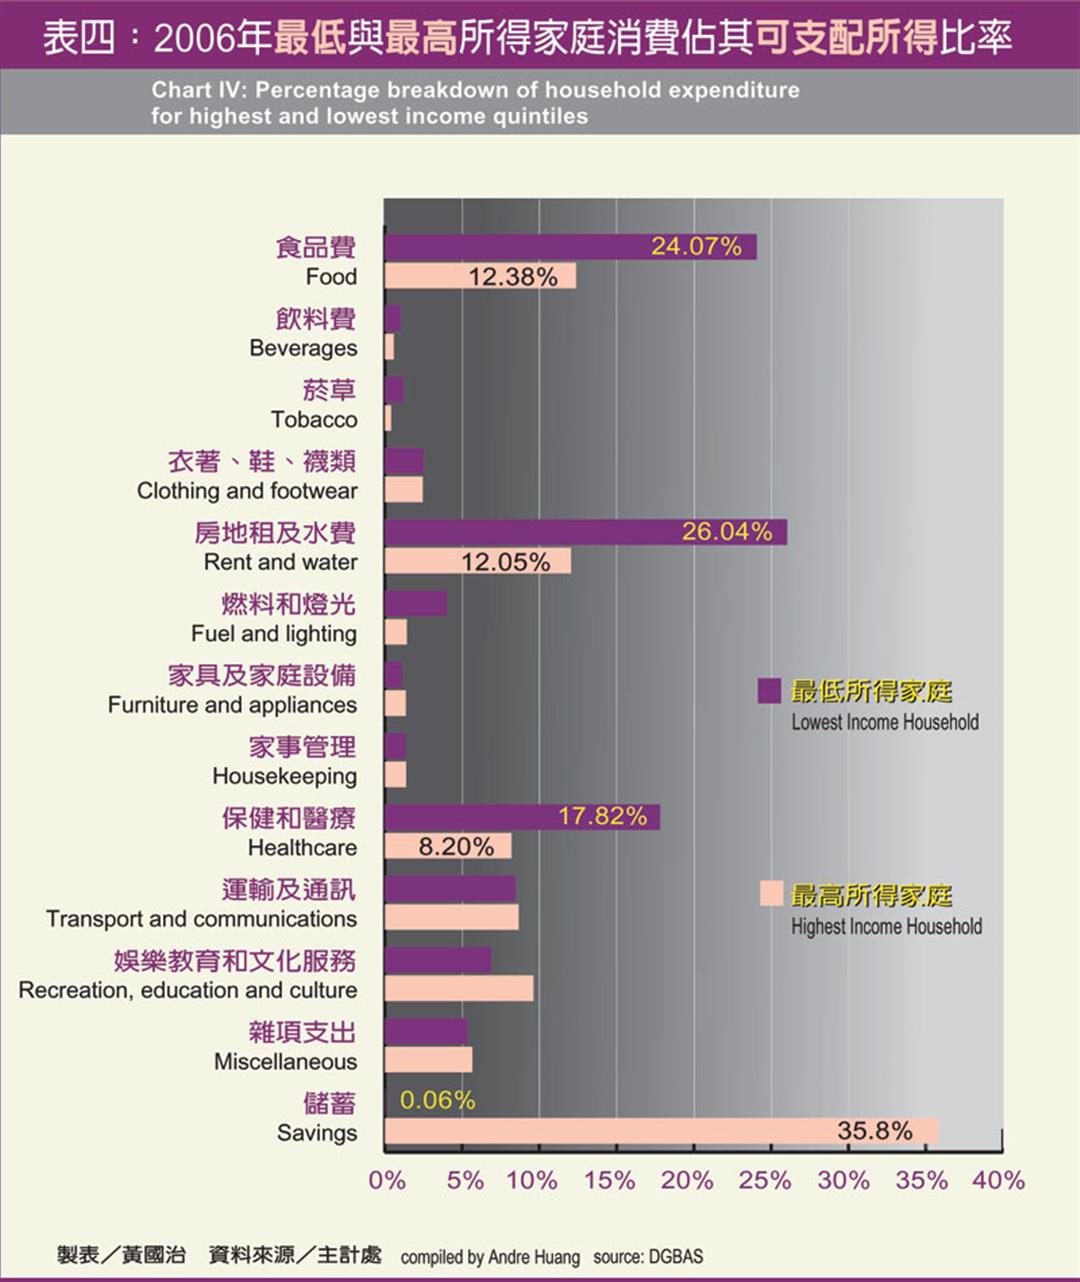
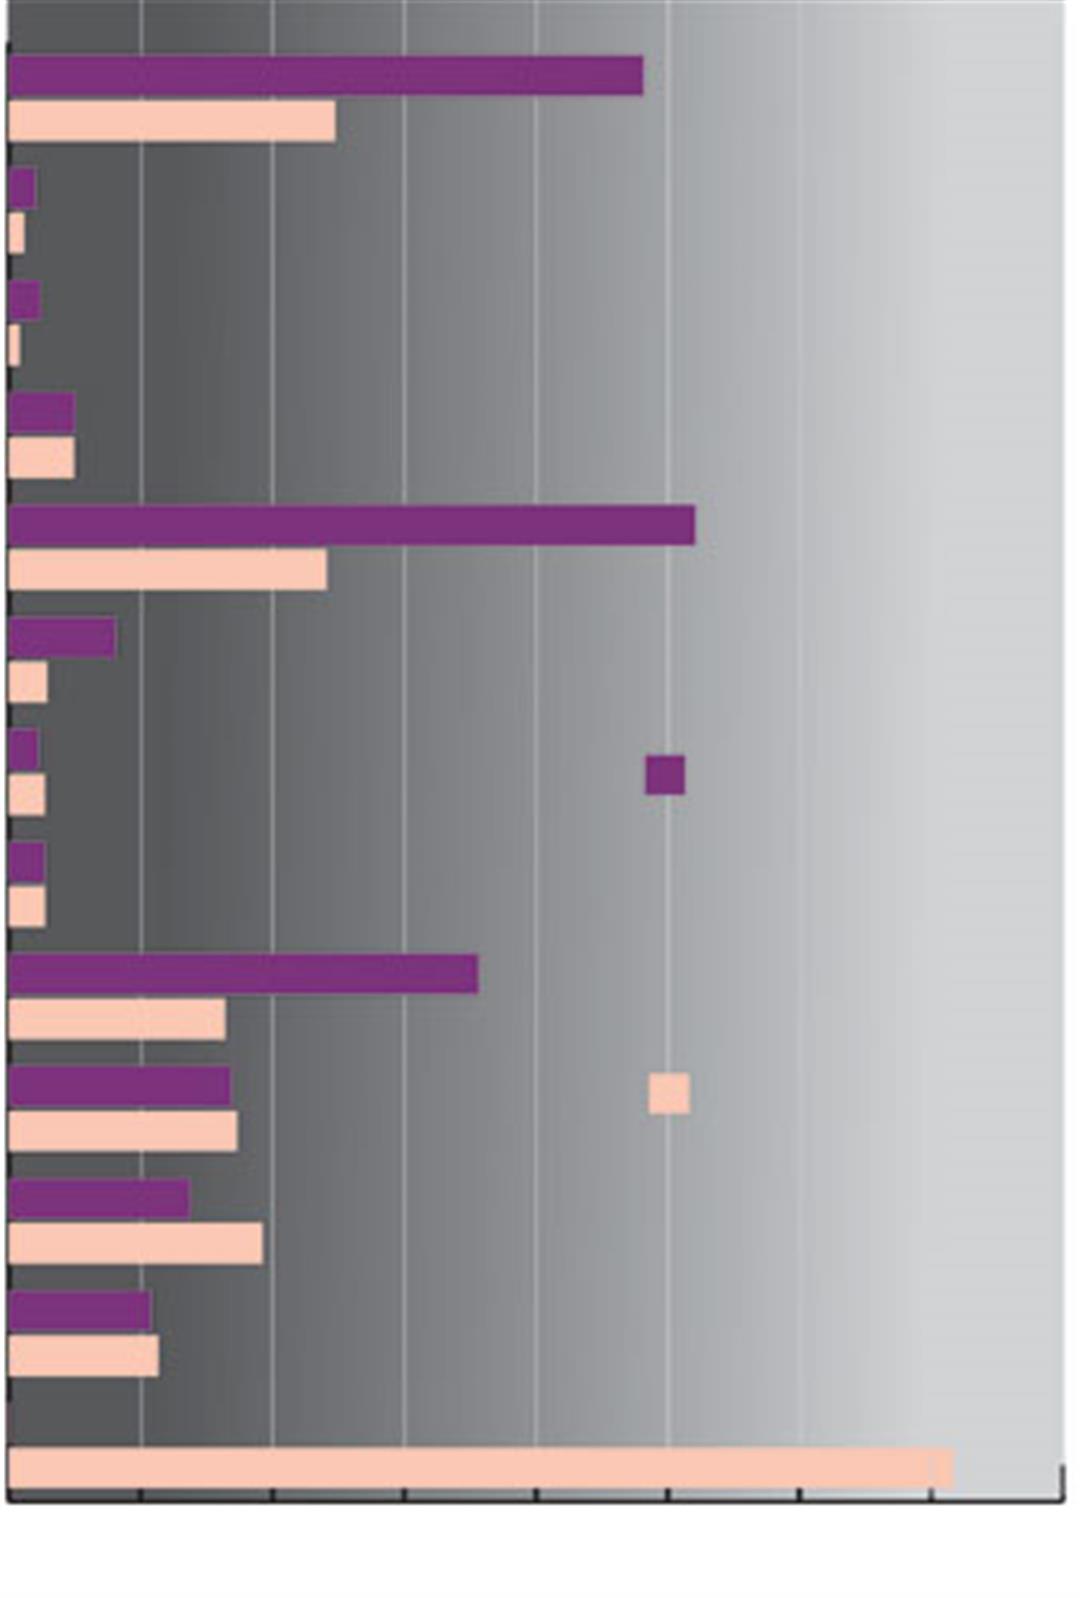
With regard to household expenditures (see Chart IV), households in the lowest income quintile spent 24% of their income on food, whereas those in the highest quintile spent 12%. For housing and electricity the lowest and highest quintiles spent 26% and 12% respectively, and for healthcare they spent 18% and 8%. But food and health were the categories of the CPI that experienced the biggest jumps in recent years, in particular for such items as eggs (an important nutritional item for poor people), which went up 54%, and fruit and vegetables, which went up 56%. As a consequence, the food products that the poor need the most went up most in price. Moreover, food and healthcare products are necessities that can't be cut back on much. The greatly different impact of rising prices on the rich and the poor has set off alarm bells. Consequently, the government has implemented various programs in recent years with the aim of helping the poor meet their basic needs.
Beyond the CPI
There are several reasons behind the rise in prices over the past few years. The economic rise of China, India and Russia has led to a growing demand for raw materials, which in turn has led to global shortages. And international financial speculations on oil and related products have also pushed prices up.
And behind these factors is a long-term trend: the gradual depletion of oil reserves. Some experts have declared that at current rates all the known oil in the world will be used up in 40 years. The trend of a rising price of oil thus seems hard to avoid.
We are hearing the death knell of the century of oil. The model of making rapid economic growth from low-cost goods that rely on cheap energy and petrochemicals is coming to an end. The working folk first affected by this change must carefully consider their purchases and tighten their purse strings, and together we all must consider what future path to take.
Year | Average disposable income per household |
Average disposable income per household by quintile | Consumer Price Index | |||||
---|---|---|---|---|---|---|---|---|
1 | 2 | 3 | 4 | 5 | ||||
1996 | 82.6 | 29.8 | 53.7 | 72.3 | 96.6 | 160.7 | 96.10 | |
1997 | 86.3 | 31.2 | 55.7 | 75.4 | 100.4 | 169.0 | 96.96 | |
1998 | 87.3 | 31.1 | 56.1 | 76.5 | 101.5 | 171.4 | 98.60 | |
1999 | 88.9 | 31.7 | 57.4 | 77.8 | 103.2 | 174.4 | 98.77 | |
2000 | 89.1 | 31.5 | 57.1 | 77.9 | 104.4 | 174.9 | 100.01 | |
2001 | 86.9 | 27.9 | 52.5 | 74.0 | 101.3 | 178.6 | 100.00 | |
2002 | 87.6 | 29.2 | 53.9 | 74.4 | 100.5 | 180.0 | 99.80 | |
2003 | 88.2 | 29.6 | 54.5 | 74.5 | 102.1 | 180.0 | 99.52 | |
2004 | 89.1 | 29.7 | 55.5 | 77.6 | 103.6 | 179.2 | 101.13 | |
2005 | 89.5 | 29.8 | 55.6 | 77.9 | 104.3 | 179.7 | 103.46 | |
2006 | 91.3 | 30.4 | 56.5 | 79.5 | 107.4 | 182.7 | 104.08 | |
Growth getween 1996 and 2006 | 10.49 | 1.95 | 5.14 | 10.01 | 11.12 | 13.71 | 8.30 | |
compiled by Andre Huang/source: DGBAS/units: NT$10,000
|