Yap's Maps: A Hundred Ways to Depict Taiwan
Andre Huang / photos maps courtesy of Yap Ko-hua / tr. by Chris Nelson
March 2008

Many may still remember May 27, 2004, when newly appointed education minister Tu Cheng-sheng spoke at Academia Sinica, using a map of Taiwan rotated 90° to the left to convey his Taiwan-centered view of history. The map was quite different from what we were accustomed to seeing, and in the heated KMT vs. DPP political environment it generated swift condemnation from the opposition. It may be one of the most contentious maps in Taiwan's recent history.
But what if we disregard ideology and just discuss the appearance of the map and the designer's original intent? Most people have no clue. It's not well known that the map's designer was just a doctoral candidate, and he wasn't even studying a map-related field like geography, but rather geology: experimenting on rocks.
This person is map guru Yap Ko-hua.
Besides exam preparation, marking territorial bounds and helping you find your way around, what else can maps be used for?
On August 31, 1854, there was a severe outbreak of cholera in London's Soho district, and within two short days 199 people were infected and 70 died. The disease kept spreading.
People were at a loss what to do, and the inhabitants fled in droves. On September 2, a doctor by the name of John Snow stepped in to investigate, marking on a map the residences of all those infected. Remarkably, he found that the cases were clustered around a specific spot. Then Snow, suspecting that the cholera germs had been transmitted through contaminated food or drink, isolated the sick from the healthy and investigated their everyday diets. Through in-depth investigation and comparison, he soon discovered that the germs might be coming from a well in the center of the district. After the pump on the well was disabled, the epidemic was contained. In later generations, Snow has been venerated as the father of modern epidemiology.
Snow was able to unravel the mystery of an illness and save countless lives thanks to skilled use of a map. As with the cholera sufferers in this example, all things take place within a certain space, and their developments and interactions can influence the course of events. If some insightful person is able to reconstruct such hidden interactions on a map, then the causal relationships in the background can appear vividly before the eyes, just like with Harry Potter's Marauder's Map.
This is why Yap keeps making maps.
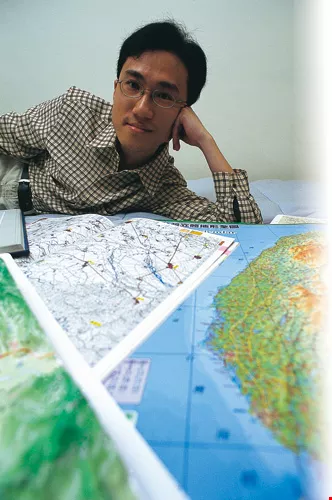
Thirty-year-old Yap Ko-hua is intimately familiar with all kinds of maps of Taiwan. But his is no idle passion-to him, maps are a valuable tool for social science research.
Maps Can Talk
Case 1: Do you know which city or county in Taiwan produces the most professional baseball players? From the map 2007 Distribution of Pro Baseball Player Origins in Taiwan in Yap's article "What Areas Are Strongest in Baseball?" it can be seen that the regions south of the Tropic of Cancer are especially productive. In particular, Taitung County, the setting of The Red Leaf Legend, produced 42 pro ball players out of a population of 230,000. In comparison, a scant nine players originated from the entire central region of Taiwan. Whether this is due to ethnic makeup, baseball culture or climate awaits further study.
Case 2: Do men worry about not finding a wife? On the map 2000 Distribution of Gender Proportions in Taiwan in Yap's article "Male/Female Matching," we see that there are more females than males in Taipei and Taichung Cities, perhaps the result of higher demand for women in service industries in densely populated urban centers, or maybe because women want to escape traditional rural male chauvinism. Plus, the prospects and salaries of "pink-collar" workers are higher in the cities than elsewhere, and men coming to the cities to find a spouse need to meet a higher standard.
Case 3: Do you know where the most premiers and cabinet ministers have come from over the years? Take a look at the map Places of Origin of Premiers and Ministers of Eight Ministries in Yap's article "Who Governs Taiwan?" and you'll find that the lion's share of KMT leaders have originated from Jiangsu and Zhejiang provinces, while many DPP leaders have come from Chiayi and Tainan. It appears that regional connections play an important function.
These are only a taste of the variety of topic maps on Yap's blog, Maps Can Talk.
Secrets of spatial distributions
Tidy and refined in appearance, Yap, born in 1978, is pursuing his PhD at National Taiwan University. He has published over 100 such maps since launching his website in August 2006. He constructs his maps using various statistical data released by the government, to which he applies the latest GIS technology (see "An Intro to GIS"). Some maps serve as a source of amusement and curiosity, but many others touch upon serious historical and cultural topics. They're tools Yap can use to organize his thoughts and address topics in his research.
For instance, in his article "Who Likes Speaking Mandarin?" there are two maps: 1930 Japanese Language Prevalence in Taiwan and 2004 Household Language Use. The first shows the proportion of people who spoke Japanese when Japan ruled Taiwan, while the second shows the geographical distribution of families that use local languages (Hoklo, Hakka or Aboriginal languages) in the home versus those that use Mandarin. They reveal that the regional distributions of households speaking the "national language" during the two periods are in fact almost the same-mainly metropolitan areas such as Taipei, Taichung, Tainan and Kaohsiung-showing that it was easier to learn the official language in centers of government power. Furthermore, minority groups had to learn the official language to communicate with other groups due to the limited ranges of their native languages; so today Mandarin is more prevalent in Hakka-dominated towns than in Hoklo-dominated towns, just as Japanese was during the Japanese occupation. The degree of influence of factors such as political power, ethnic differences and linguistic spread are topics for further research.
Yap, whose dissertation will be on electoral research, has no strong party affiliation. However, he is mesmerized by the maps and data that are released after each election, using maps to record and compare historical voting distributions in Taiwan.
His research reveals numerous mysteries: the so-called "blue north, green south" phenomenon is most evident on the city/county level and above, but in the townships and villages, blue and green areas are more mixed together. However, another study of his, published in the American academic journal Asian Survey, showed that the "blue north, green south" division was not clear-cut in 1994, but the disparity gradually grew stronger and more distinct starting around 1998 or 2000. This result is worthy of contemplation in politically divided Taiwan.
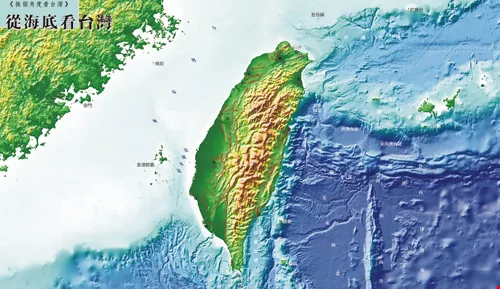
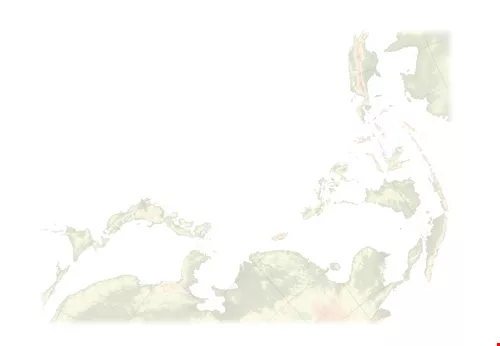
Taiwan's features are displayed in different ways in the "Looking at Taiwan from New Angles" map series. The map to the left blends sea floor topography and landform data. In the middle is a world map projection with Taiwan at the center, clearly showing the shortest (i.e., great circle) distances between Taiwan and other places. The map on the right stresses the cultural and historical relations of the Austronesian-speaking peoples of Taiwan and other south sea islands.
Geographical sensitivity
It's as if it were an inborn tendency. Despite growing up without peers with similar interests or the encouragement of his parents or teachers, Yap has been fascinated with spatial differences all his life, and he was able to depict these spaces concretely, freeze-framing them on 2-D maps.
He recalls that he would never sleep when he was in a car during his childhood, always staring at the scenery outside the window and developing a curiosity about the changes in people and things in the different regions he passed through. But his earliest recollection of maps came from his father, Yap Ching-sung, a textile-factory worker.
"Every time we went out when I was a kid, my father never got lost and always arrived on time, no matter how unfamiliar he was with the area. Unlike other relatives, who often got lost or delayed, my father would study the route on a map before setting off, and this got me deeply fascinated with maps," says Yap.
Enamored with maps, Yap was able to draw a map of China, with all 35 provinces, from memory while still in first grade, and he answered his teacher's geographical questions with ease. But this wasn't enough for him. Later, using his imagination, he would draw different political divisions on maps, and before he ever had video games, he designed formulas and rules for strategic games to simulate the Warring States of ancient China vying for domination.
Blazing an alternate trail
With Yap's lifelong infatuation with maps, it would seem that geographical research would be a natural course for him. However, as a person of broad interests, he showed exceptional performance in the natural sciences, and his move toward anthropogeography and becoming a cartographer was happenstance to a degree.
During his youth, Yap had resolved to become a top-notch physician. When he was in tenth grade at National Taichung First Senior High School, he won first place at a national science fair for his experiment in fluid mechanics regarding the design of a windbreak wall. At the same time, he was selected as a national honor student in physics, traveling every other week to National Tsing Hua University in Hsinchu to undergo special training. The door to the world of physics seemed wide open for him. Yet he also realized something from his experience learning from national physics experts: "To stand out among the myriad brilliant minds in the world of physics, you have to be a genius among geniuses. With my native intelligence, there was no way I'd be able to stand out," laughs Yap.
With his inability to scale the heights of physics, what was he to study? Still clinging to his dream of becoming a scientist, at that time he didn't even think about geography, generally classified as a social science, and instead brainstormed until he found a less popular subject that would allow him to travel around Taiwan: geology. Though his grades were good enough to enter top-rated NTU, not coming from a wealthy family he chose instead to study earth sciences at National Cheng Kung University, which offered him a four-year full scholarship.
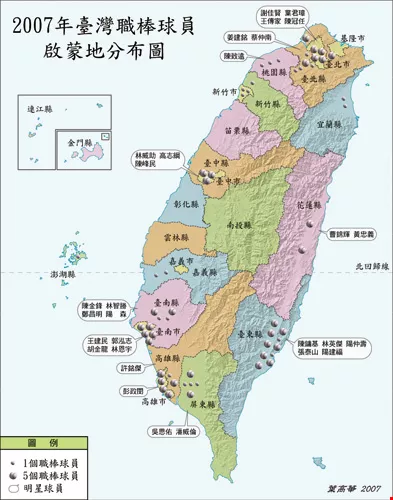
Do you like baseball? This map shows that the majority of pro baseball players in Taiwan come from the southern cities and counties.
From geology to geography
A major part of his geological research involved gathering mineral specimens from all over Taiwan and analyzing their chemical makeup. Yap traversed the entire island collecting rocks. But during his four years of undergraduate study, he found that geological research was pretty much exhausted on the land of Taiwan, and to get ahead he would have to go to sea-researching the undersea geology around the island. So for his master's degree studies, he entered the Institute of Oceanography at NTU, spending time on boats harvesting rocks from the sea floor. As such, he has not only traveled throughout Taiwan, but also circled the island several times.
Though his purpose for covering so much ground was for geological research, during the process Yap became acutely aware of differences and similarities between people and things around Taiwan, which struck him profoundly. For instance, through contact with residents of different areas, he found that that Hoklo people exhibited different accents-Lukang, Ilan, Haikou and so forth-which aroused his interest in the geographical distribution of different accents. He also found that the characteristics of village residencies were as Japanese scholar Yoshiro Tomita noted long ago, "People in the north are mostly scattered outside villages (with houses near arable land), and people in the south are mostly concentrated in villages (with arable land outside the villages)," and that there were differences in the distributions of surnames, with "coastal names" such as Yang and Tsai, and "inland names" like Lai. Such findings reinforced his fondness for geography.
More importantly, as time passed and his contacts broadened, Yap found that his passion for testing rocks was waning, while he was growing increasingly interested in social phenomena. His will to study geographical differences in social phenomena formed gradually, foreshadowing his subsequent change in path toward human geography.
Yap didn't know anyone who was as passionate about maps as he was until he met Huang Ching-chi during his graduate studies. Thanks to this stroke of luck, despite working toward his PhD in geology at NTU, Yap was invited in 2003 by Huang, then a teaching assistant for the Department of Geography, to take part in a research project. It was a map research project titled "Looking at Taiwan from New Angles," held jointly by the Council for Cultural Affairs and NTU's Department of Geography. Thereafter, he switched his major to geography, becoming the first doctoral candidate in NTU history to successfully switch a field.
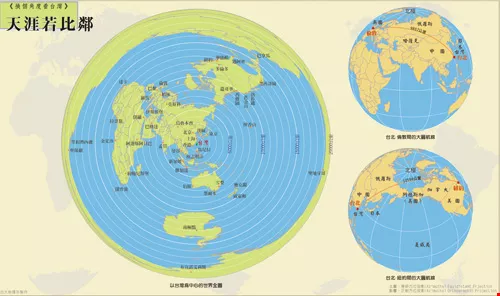
Taiwan's features are displayed in different ways in the "Looking at Taiwan from New Angles" map series. The map to the left blends sea floor topography and landform data. In the middle is a world map projection with Taiwan at the center, clearly showing the shortest (i.e., great circle) distances between Taiwan and other places. The map on the right stresses the cultural and historical relations of the Austronesian-speaking peoples of Taiwan and other south sea islands.
The earth is like a tangerine
It was during the making of the "Looking at Taiwan from New Angles" map series, a turning point in Yap's academic career, that the scandalous horizontal map of Taiwan would come from his own hand. Yap was flabbergasted that the map he created became a political flashpoint. In fact, within this series of maps, there were some that followed the convention of north at the top, while others were presented from the side to show Taiwan's mountains three-dimensionally, and still others highlighted the topography of the sea floor surrounding Taiwan. There was no controversy for almost six months after the maps were published.
Yap takes out the original map marked with a latitude and longitude grid, explaining, "The title of the map is Our East Asian Neighbors, and its purpose was to show the countries around Taiwan. A lot of people think this map is just Taiwan rotated 90° counterclockwise. But in fact, if we look at the latitude-longitude grid, we can see I used a particular projection called the oblique Mercator projection, because it's the most faithful way to represent the East Asian island arcs."
"The earth is like a tangerine," says Yap, further elaborating on the differences between a three-dimensional surface and a flat map. "When we peel off the skin, we can't lay it out like a rectangle." Showing the features of the earth on a traditional map is like stretching the orange peel into an oblong shape, while forcing the stem to be at the top. The result is serious distortion and loss of realistic representation.
"For example, on the world maps we usually see, Greenland, which has less than a third of the area of Australia, looks bigger than Australia, which is misleading. Therefore we should to choose the projection best suited to the subject in order to best represent the facts."
Education minister Tu's use of the map in 2004 to advocate his abandonment of the Greater China concept and adoption of a Taiwan-centric view of history was lambasted by the opposition party as an advocacy of "desinicization" and Taiwan independence, because mainland China was at the bottom of the map and only shown in part. The map was transformed into a political wrestling match between pro-unification and pro-independence camps. A map that had been intended to faithfully display the geographic relationships among Taiwan and nearby East Asian countries instead became an object of scorn.
Looking back at this controversy, Yap notes that the variety of information on maps, including place names, divisions and borders, may well contain some form of ideology and historical view. It's for this reason that the Nationalist government strictly controlled maps after the war, keeping them to a uniform standard. So it can be hard for people to accept maps that are drawn in new ways. After the Statute for Examination of Maps was repealed in 2004, maps in Taiwan have become more diverse, and such disputes will gradually wane. His map's involvement in politics was certainly not Yap's intention, but the attention to the diversity of maps that it provoked is not a bad thing.
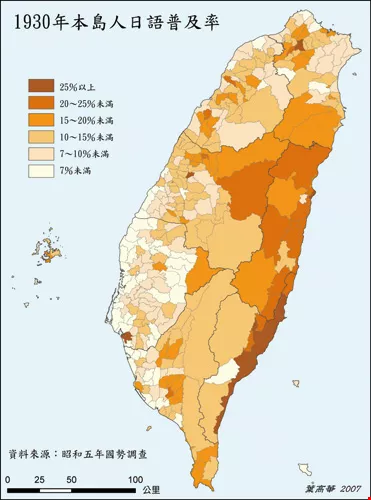
The three major urban centers where Japanese was most commonly spoken in the past in Taiwan are the same three in which Mandarin Chinese is most common today (the clusters of small pink circles on the map to the right). Interestingly, Japanese was also commonly spoken on the east coast: it was an area with a high concentration of Japanese immigrants, and where the Japanese government was more dedicated to "civilizing" the Aborigines.
Maps don't speak alien tongues
Unlike the abstruse academic research we might imagine, Yap's works are quite approachable. No matter how difficult an issue may be, his maps tell stories when he lays the facts out painstakingly on a map and explains them in plain language, lending simplicity and interest to the issue. This no doubt comes from Yap's humorous nature, and it is also a demand he makes of his own academic work.
"In academic circles, too many people speak in a kind of alien language. Even simple ideas are deliberately expressed with abstruse terminology to flaunt their expertise," Yap commented from his heart. "In fact, if you have enough confidence in and understanding of your research, you should be able to convey it in plain language that can be shared with ordinary readers. I have always believed that writing in natural language, expressing research like telling a story, is the greatest manifestation of wisdom."
To Yap, GIS maps, statistical quantification and other such techniques are merely basic tools for exploring human social issues. There's nothing lofty or mysterious about them, and they're no substitute for in-depth historical and social analysis. Thus, even though the title of his blog is Maps Can Talk, he tells it like it is: "Maps can't talk by themselves; it's people who speak through maps. By using maps and pertinent data, we can compare different ideas, exposing falsehoods and lending more persuasive power to the truth." Adhering to this conviction, Yap continues his pursuit of research into human social topics using GIS and statistical quantification techniques, and is developing his unique storytelling style.
Maps, which were once in the hands of state power, have become diversified following political liberalization, and new technologies are bringing such diversity into the lives of the people. With GIS, GPS and satellite maps, you can be like Yap, reexamining Taiwan, the Earth and even the whole of society through new perspectives and levels of detail.
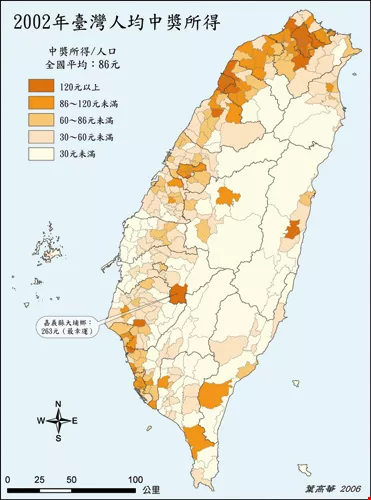
If lottery-win figures had not been represented on a map, who'd have imagined that high-income areas tended to have higher lottery winnings?
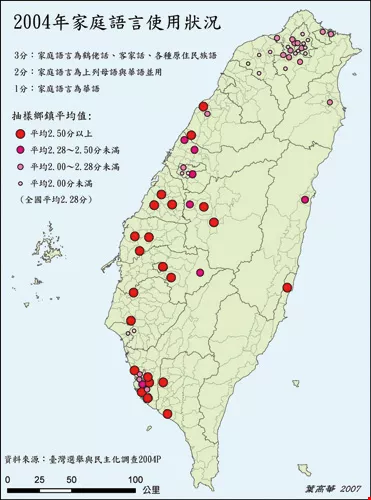
The three major urban centers where Japanese was most commonly spoken in the past in Taiwan are the same three in which Mandarin Chinese is most common today (the clusters of small pink circles on the map to the right). Interestingly, Japanese was also commonly spoken on the east coast: it was an area with a high concentration of Japanese immigrants, and where the Japanese government was more dedicated to "civilizing" the Aborigines.
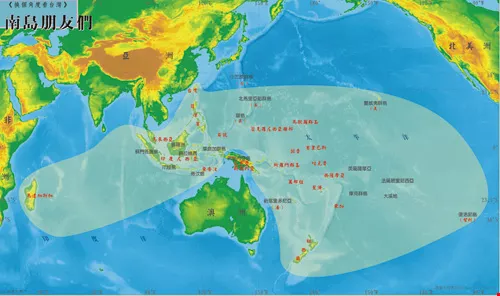
Taiwan's features are displayed in different ways in the "Looking at Taiwan from New Angles" map series. The map to the left blends sea floor topography and landform data. In the middle is a world map projection with Taiwan at the center, clearly showing the shortest (i.e., great circle) distances between Taiwan and other places. The map on the right stresses the cultural and historical relations of the Austronesian-speaking peoples of Taiwan and other south sea islands.
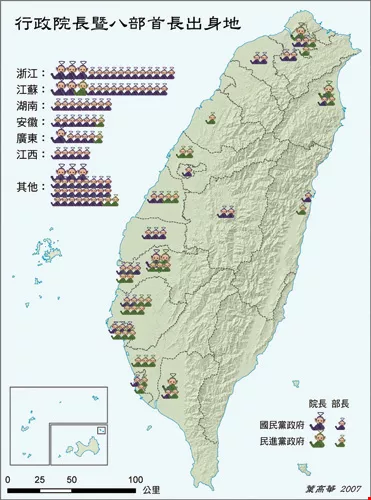
Looking at data from 1950 to today, we see that a large proportion of KMT premiers and cabinet ministers came from Jiangsu and Zhejiang provinces, whereas many of their DPP counterparts come from Chiayi and Tainan.

@List.jpg?w=522&h=410&mode=crop&format=webp&quality=80)


